JS Data Visualization Libraries
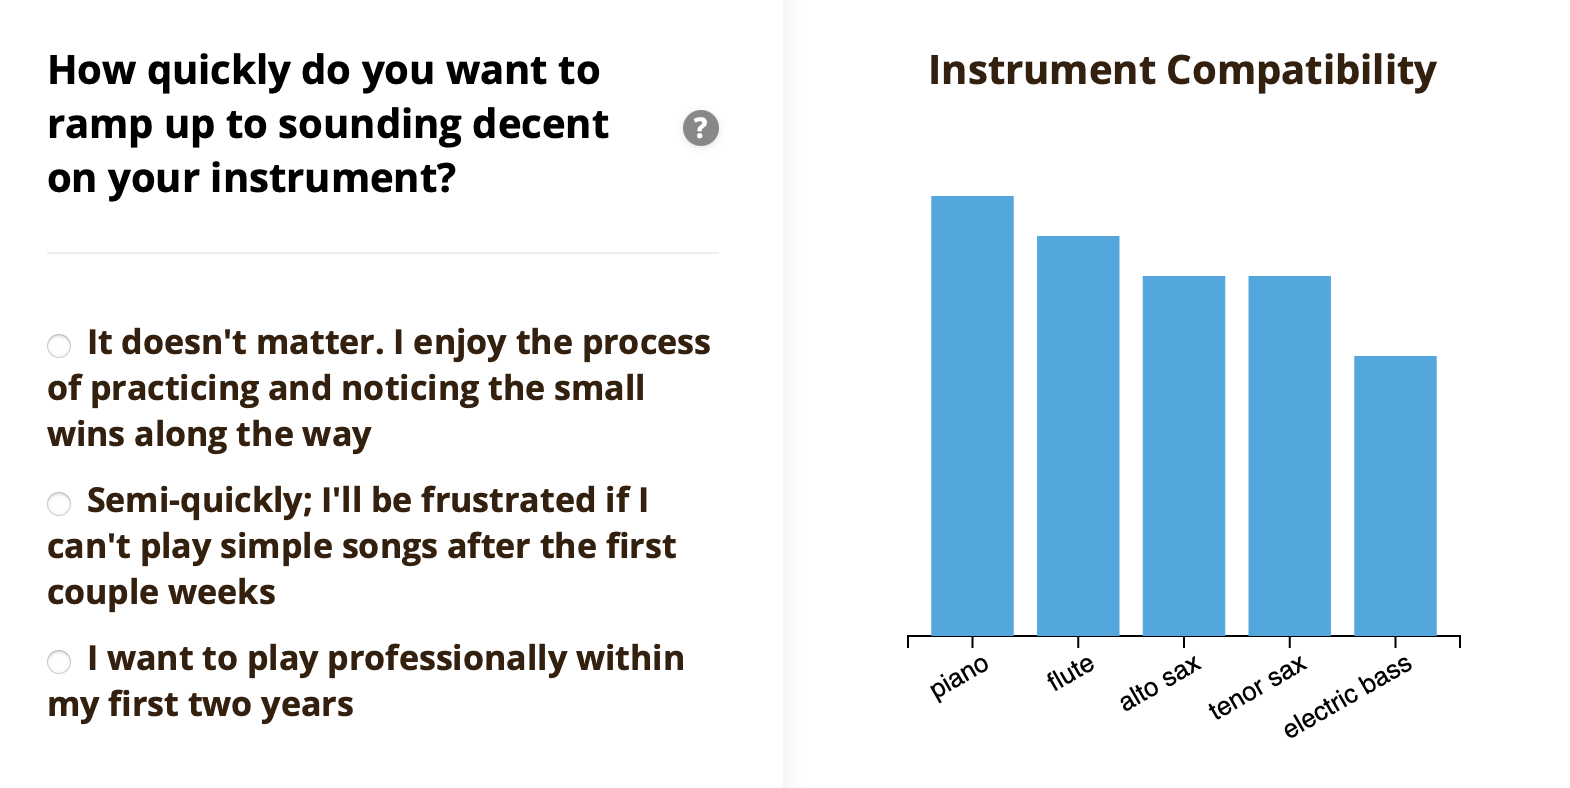
Over at JazzStickers.com I built a short quiz that helps jazz musicians pick the instrument that will best help them realize their full potential. I'm uniquely positioned to develop something like this, because among all software engineers, I have the most extreme addiction to buying musical instruments. Here's a screenshot to give you an idea of what the quiz looks like:
D3.js
Working on this gave me a chance to explore a few of the most popular libraries for rendering charts & graphs in the browser. D3.js is one of the most widely used visualization libraries and the only one I've used previously, so it's the one I reached for first. D3 is tremendously powerful, but the syntax is brutal. Here's a snippet of the code I needed to render just the bars in the above screenshot:
svg.selectAll("rect.bar")
  .data(data)
  .enter()
  .append("rect")
  .attr("class", "bar")
  .attr("x", d => x(d.name))
  .attr("y", d => y(d.value))
  .attr("width", x.bandwidth())
  .attr("height", d => y(0) - y(d.value))
  .attr("fill", colors.blue);
That level of verbosity enables uncompromising flexibility, but it comes with the cost of an API that I can't memorize. Every tweak requires combing through the docs, and I don't think it's worth it unless the underlying data needs a unique presentation that simpler libraries can't provide.
Chart.js
Compared to D3, Chart.js offers an API that reads more like "regular" JavaScript. The configuration options are extensive, but optional, meaning that getting a basic chart on the page is far easier. Here's an example configuration:
new Chart(ctx, {
  type: 'bar',
  data: data,
  options: {
    scales: {
      x: {
        type: 'category',
        labels: data.labels
      }
    }
  }
});
In most cases, the default styles won't be sufficient, and you'll be reading documentation just as with D3. However, because the API is based around regular JS objects, the learning curve for a non-expert like myself is far more forgiving. Charts.js has a wealth of features including appealing color pallettes and animated transitions.
recharts
Because my quiz and chart exist in the context of a React application, I can also consider a React-centric library like recharts. Recharts comes with attractive defaults and an even more approachable API than Chart.js. Here's a snippet of my rendered bars using recharts, which is equivalent to the 10 lines of D3 shared earlier in this post:
<Bar dataKey="compatibility" fill={colors.blue} />
The syntax for recharts is significantly more concise than either chart.js or D3. Because it's more readable and less imposing, it invites experimentation and iteration in a way that the others might not. Additionally, recharts makes a high level of polish more accessible by offering niceties like hover states, and animated transitions out of the box.
Conclusion
After trying all three, recharts is my choice for JazzStickers.com. I'm a full-stack engineer who leans back-end, and recharts' clean API is worth losing the endless customization that D3 offers. If I run into a scenario where this library isn't powerful enough, Chart.js would be my next choice.
That being said, all three libraries are very useable, and have plenty of community support. Recharts is the least used of the three, but still has 25k Github stars and commits nearly every day.
Thanks for reading!
-Adam